

The same scrapes report 15 or 115 requests per minute
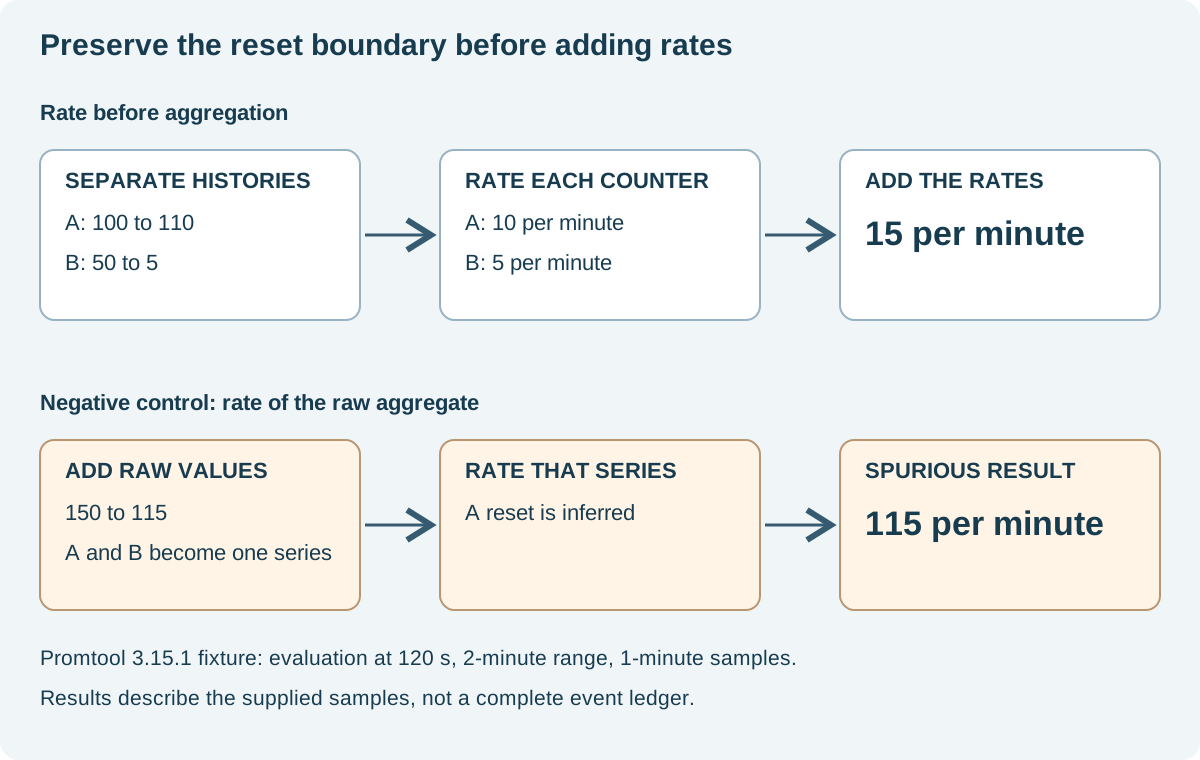
Replica A moves from 100 to 110. Replica B moves from 50 to 5 after a reset. A query that handles each counter before combining them reports 15 requests per minute in our fixture. A query that first records their raw sum reports 115. No extra requests were added to the input.
This is a synthetic two-replica trace, not a reported production outage. We reproduced it with Prometheus 3.15.1's promtool, using the real PromQL engine. The symptom comes from the order of operations: adding independent counters can destroy the history that reset detection needs.
The investigation starts with the samples and ends with a regression test. It also includes controls where the two expressions agree. A graph that looks reasonable through one restart is insufficient evidence that its aggregation is safe.
Follow the values through the recording rule
At minute 1, the raw sum is 150. At minute 2, it is 115. That combined series falls even though A continued counting normally. A counter function applied afterward sees only the fall in the aggregate. It cannot tell which part belonged to the continuing replica.
Process the replicas separately instead. A contributes an increase of 10 between the relevant samples. B's observed fall is handled as a reset, leaving 5 after the reset. In this deliberately aligned fixture, the resulting rates add to 15 per minute. The failed ordering treats the combined history as one counter and produces the spurious 115.
Prometheus's function documentation describes reset adjustment and explicitly puts rate() before aggregation. The recommendation protects information, rather than merely satisfying a preferred query style.
This is also why dropping an instance label is not automatically a cardinality optimization. The Prometheus data model identifies a time series by its metric name and label set. Independently resettable emitters need distinguishable input histories until the counter operation has consumed those histories. The cardinality article covers identity counts. It does not authorize merging raw counters.
Reproduce five cases in the actual query engine
The downloadable Python runner writes the negative-control recording rule and test fixture, invokes an installed promtool and writes verified results. Save the files in an empty writable directory. The runner uses Python's standard library and makes no network requests.
Our run used the official Prometheus 3.15.1 release for Darwin/arm64. Its downloaded package checksum matched the release checksum before execution. Use the appropriate official package for your platform. The published evidence describes the platform actually tested.
python3 experiment.py --promtool /path/to/promtoolTo run the two YAML files directly, keep them in the same directory and run promtool test rules counter.test.yml. The rule-testing documentation defines the input-series and expression-test format. These tests run locally without starting a monitoring server.
The first test group supplies samples at seconds 0, 60 and 120. Each series repeats its starting value at the first two points, then receives the final value. Evaluation occurs at second 120 with a two-minute range. The range selector excludes its left boundary, so the relevant raw samples are those at 60 and 120. A separate group provides just one usable sample and expects an empty rate vector.
The two tested expressions are:
60 * sum by (scenario) (rate(requests_total[2m]))
60 * rate(service:requests:raw_sum[2m])
scenario is a synthetic label separating the five datasets. The second expression reads a recording rule that sums the raw replicas by scenario every minute. It is an intentional negative control, not a configuration recommendation. Multiplying by 60 converts the per-second rate into a per-minute display unit.
A visible fall is only one way to lose the reset
| Synthetic case | A at seconds 60 and 120 | B at seconds 60 and 120 | Rate then sum, per minute | Raw sum then rate, per minute |
|---|---|---|---|---|
| No reset | 100 to 110 | 50 to 60 | 20 | 20 |
| Visible aggregate fall | 100 to 110 | 50 to 5 | 15 | 115 |
| Reset hidden by A's growth | 100 to 200 | 50 to 5 | 105 | 55 |
| Unchanged aggregate | 100 to 145 | 50 to 5 | 50 | 0 |
| Both replicas reset | 100 to 2 | 50 to 3 | 5 | 5 |
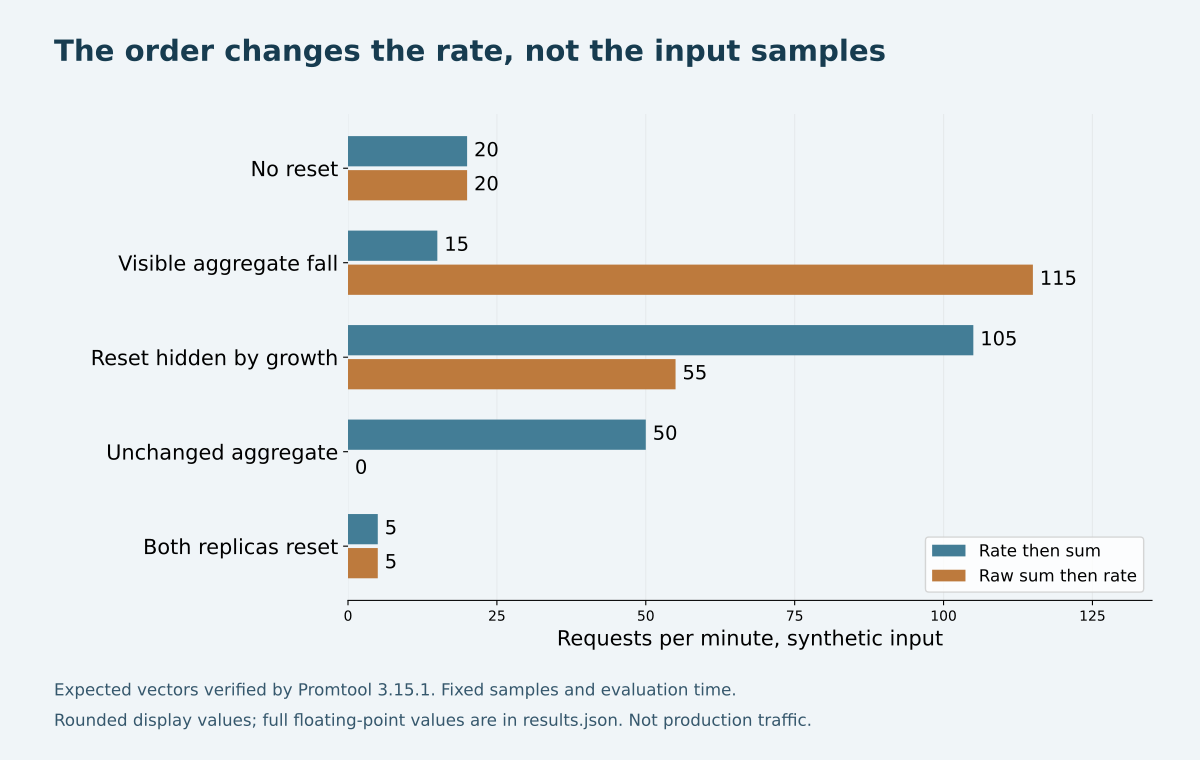
In the third case, A's growth more than offsets B's observed fall. The total rises from 150 to 205. Applying the counter function to that total misses B's reset contribution and reports 55 rather than 105. The defect can undercount as well as create a spike.
The fourth case is quieter still: both aggregate samples equal 150. The flawed path reports zero, while the per-series path reports 50. An unchanged raw total does not establish that no work occurred.
Both expressions have the same displayed result in the no-reset and simultaneous-reset controls. Agreement there does not rescue the other cases. The engine verified ten expected vector values across the two expressions, plus one empty-vector expectation for the single-sample group. Table and chart values are rounded for display; the full floating-point expectations remain in results.json. One confirmed value is 5.000000000000001, rather than the decimal display value 5. No numeric tolerance was widened to make that comparison pass.
Distinguish an estimate from an event ledger
rate() estimates a per-second rate over a range and extrapolates toward its boundaries. Its result is not generally the raw endpoint difference divided by the requested duration. These sample times were chosen to make the counterexample inspectable, not to define an implementation of PromQL in Python.
A counter can also reset and grow past its previous value between scrapes. The two observed values then need not reveal the reset. Applying rate() first preserves the available per-series evidence. It cannot recreate observations that were never collected. Additional restart context may help an investigation, but it does not turn the samples into a complete event history.
Do not replace a missing series with zero merely to make the panel look continuous. The single-sample test returns no rate result. It does not certify zero traffic. Missing scrapes, disappeared targets and a changed label set need their own checks before absence becomes a service-level conclusion.
The fixture covers ordinary float counters. Native histograms, out-of-order samples, duplicated collection and high-availability deduplication were not tested. Its results are query-correctness evidence for the supplied samples, not a production traffic estimate or a benchmark of Prometheus.
Trace the first aggregation boundary before changing the dashboard
Inspect the expression behind the panel and every recording rule it references. A correctly written final query cannot recover independent histories from an upstream rule that already stored only the raw sum. Locate the first point where emitters become indistinguishable.
A useful diagnostic sequence is to inspect each original series around the restart, compare the recorded aggregate at those same timestamps and evaluate the corrected expression against the original inputs. Keep the evaluation time and range identical. Changing the time window while changing the aggregation makes the result harder to explain.
Prometheus recording rules evaluate expressions into new time series. When replacing a raw-counter aggregate with an aggregated rate, use a name that makes the new meaning and units explicit. Do not mix the two meanings under one metric name and then read across the change as though the history were uniform.
Check downstream consumers before switching: a panel expecting requests per second, an alert with a threshold and a derived ratio can all depend on the old rule. A rolling change needs to identify which consumers still use the earlier series. The SLO burn-rate walkthrough addresses ratio populations and windows. Corrected counter handling is an input requirement for that later calculation.
Close the investigation with a failure the rule must explain
Retain the visible-fall and unchanged-sum cases in a local regression fixture. Include the no-reset control so a fix does not merely special-case restarts. Verify both the expected labels and values, since an apparently correct total can still combine the wrong population.
Use fresh inputs representing your own sampling cadence, restarts and missing-data behavior before changing a live rule. This lab evaluates a recording rule at a fixed one-minute interval; it does not reproduce scheduler delays, scrape jitter or a production deployment. Keep those integration checks separate from the deterministic fixture.
The Prometheus practice guide gives the operational rule: preserve counter semantics before aggregation. For a dashboard investigation, the concrete next step is to recover the original per-instance samples, replay the failing timestamps and identify the earliest rule that discarded the reset boundary.
Sources
Documentation checked .
Continue the conversation
Comments (0)